How can you identify non-human actors on social media? There are many ways to do this, and each method has its strengths and weaknesses. In this post, I discuss how to use Benford’s Law to identify non-human actors in user interaction logs.
Application of Benford’s Law
Benford’s Law is an observation that a collection of numbers that measure naturally occurring events of items tend to have a logarithm frequency distribution for the first digit of these numbers. The are several characteristics of a naturally occurring set of numbers that Benford’s Law takes advantage of:
- The order of magnitude of the number in the set varies uniformly
- The numbers vary with multiplicative fluctuations
- The distribution of numbers is scale invariant
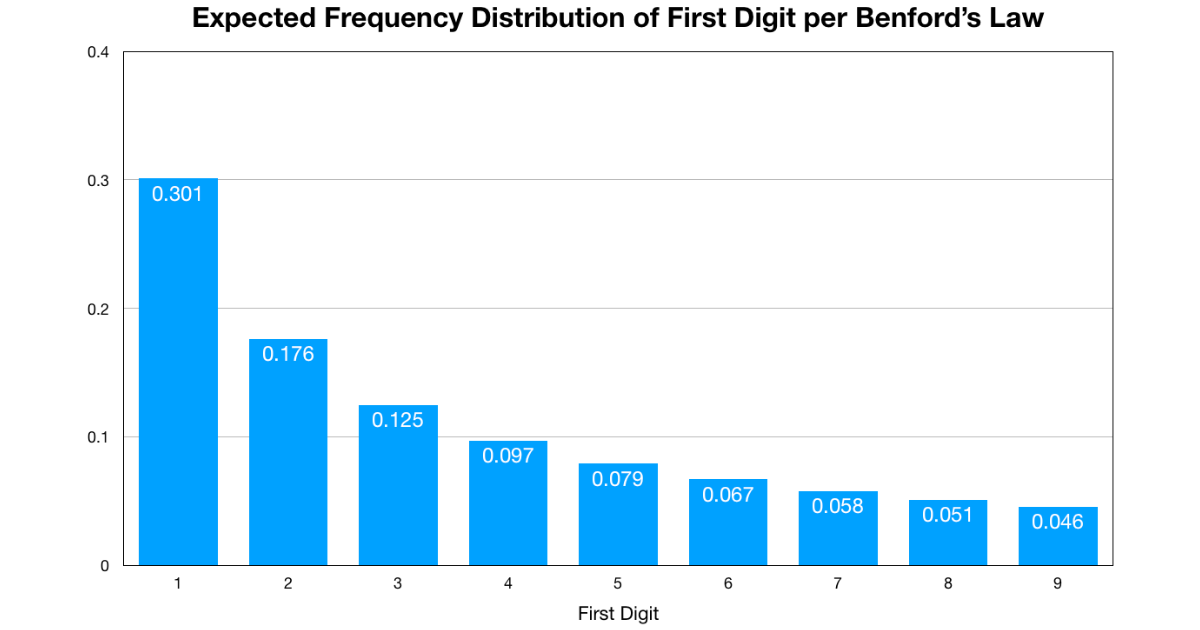
The exact distribution of first digits that Benford’s Law predicts is:
P \left (d \right )=log_{10}\left ( \frac{d+1}{d} \right )
This results in a distribution that looks like this:
For a collection of numbers, if the frequency of the numbers’ first digits does not align well with the distribution shown above, then that collection of numbers is suspected to not have been generated by a natural process. You can this use this principal to identify user activity that is likely not caused by an actual human being.
A common application of Benford’s law is to analyze a log of user events in order to determine which users are likely to be bots. But the challenge here is formulating the problem right so that one can apply Benford’s Law. Most typical user logs have a structure something like this:
timestamp, user_id, user_action
Most usage logs are a bit more complex than that, but at the core, it does consist of a user, and action the user did, and the timestamp of that action. One might conclude that all we have to do is look at the distribution of timestamps and we can identify bots. The problem is this won’t work with Benford’s Law. Most timestamp schemes are measured in the number of seconds or millisecond since an epoch. If you look at the Unix timestamp, which uses an epoch if January 1, 1970, the current value for it is about 1,585,000,000, or about 1.5 billion seconds since January 1, 1970. The current timestamp has had a first digit of 1 since September of 2001, and 1 will continue to be the first digit until May of 2033. Basically, the scale of the numbers in set of time stamps from current user actions takes a very long time to change, meaning for most collections of log data the timestamp doesn’t vary in order of magnitude as needed for Benford’s Law to work.
However, with a transformation, we can make it work. While the exact time of a user interaction has a pretty consistent order of magnitude for most reasonable analysis time windows, the amount of time in between each user interaction can vary greatly, especially for human being caused interactions. Think about your own web browsing activities. Maybe one website you spend 10 seconds at, and the next website you spend 10 minutes (600 seconds) at, and then you don’t browse again until the next day. The order of magnitude varies greatly for the time in between those interactions, making the time lag between user events appropriate for testing with Benford’s Law.
The methodology for testing whether a set of user generated events complies with Benford’s Law or not, and thus whether the user is likely to be a human or not, is to first transform the raw log data with timestamps to having for each row the amount of time that has elapsed since the last user event, which is simply the difference of the two timestamps. Once the draw event logs are prepared this manner, the distribution of first digits for the time lag measurements can be found, and then that distribution can be compared to the ideal distribution using some statistical similarity measure, such as the \chi ^{2} test. If the user’s interaction time lag measurements fit closely to the Benford’s Law distribution, then the user is likely a human. If the distribution is not close, then the user is likely a bot.
Why would a user’s interactions fail the Benford’s Law test? The most likely reason is because the interactions are being generated by some code that runs are regular intervals. When the interactions occur at consistent intervals, the the first digit of those interval measurements is likely the same for all events. This violates Benford’s Law. If the bot tries to mask it’s regular intervals by randomizing the interval time, this will likely fail the Benford’s Law test too. this is because most random number generators are uniformly distributed in the values it generates, typically between 0 and 1. A uniform distribution of values will result in a uniform distribution of first digits for those values, which in turn violates Benford’s Law. With that said, a bot could fool a Benford’s Law test by using a modified random number generator that complies with the Benford’s Law distribution. But in my experience, most bots are not that sophisticated.
Implementing Benford’s Law in PySpark
While you can certainly hand calculate a single user’s compliance with Benford’s Law, the utility of this test is most found when you are trying to identify the likely non-human actors in a very large collections of users. To operate at that scale, you would use a distributed computer platform like Apache Spark.
The first step in analyzing the data is to find the time delta between each consecutive event for a user. To do this, the window function lag() helps out tremendously:
import pyspark.sql.functions as F
import pyspark.sql.types as T
from pyspark.sql.window import Window as W

user_timestamp_window = W.partitionBy('user_id').orderBy('timestamp')

timestamp_delta = F.col('timestamp') - F.lag(F.col('timestamp')).over(user_timestamp_window)

log_with_lags_df = (
  log_data_df
  .select(
    'user_id',
    'timestamp',
    timestamp_delta.alias('time_delta')
  )
  .filter(F.col('time_delta').isNotNull())
)
The next step would be to find the distribution of the first digits for the time deltas that for each user.
user_digit_window = W.partitionBy('user_id').orderBy('first_digit')

digit_share_df = (
  log_with_lags_df
  .withColumn(
    'first_digit',
    F.substring(
      F.col('time_delta').cast(T.StringType()),
      0, 1
    ).cast(T.IntegerType())
  )
  .withColumn(
    'first_digit_cum_dist',
    F.cume_dist().over(user_digit_window)
  )
  .groupBy('user_id','first_digit','first_digit_cum_dist')
  .agg(
      F.count('created_utc').alias('frequency_count')
  )
  .withColumn(
    'first_digit_share',
    F.col('first_digit_cum_dist') - F.coalesce(
      F.lag('first_digit_cum_dist').over(author_cum_dist_window),
      F.lit(0)
    )
  )
  .repartition('user_id')
)
Note that I have a repartition() operation at the end. My experience is that at this point, the data can get skewed within the partitions of the data frame. Repartitioning on the primary key ends up being a prudent action here.
I will also point out an important but potentially non-obvious behavior of the window function cume_dist(). Basically, the cumulative distribution is done on the values by which the rows in the window are sorted by. The Spark documentation doesn’t explicitly mention this, but the code documentation does make it clearer. This means when the the window is sorted by the first digit value, the cume_dist() window function is giving us the cumulative distribution of each distinct first digit value based on their respective row counts within the window. Then, in order to end up with the relative share of rows each first digit has, we just have to find out the difference between the cumulative distribution between each consecutive digit.
The next step is to clean up the data such that we have an entry for each possible digit for each user. What is at issue is that some users will have no time deltas from all possible first digits. In order to compare the set of first digit shares with the Benford’s Law distributions, things will work better if all users have a row for all possible digits even if that row indicates that digit has a zero share for the user. To accomplish this, I construct a data frame with all the possible user and first digit combinations, and then do an outer join against that dataframe to insert empty rows where they are needed. While I am doing this, I can also filter out users that did not have a large number of events because analyzing these low activity users does not yield good results.
# Generate the set of users we will do analysis on, and create the digit key set for each user
digits_df = (
    spark
    .createDataFrame(
        [[1], [2], [3], [4], [5], [6], [7], [8], [9]],
        schema=T.StructType([
            T.StructField(
                "first_digit",
                T.IntegerType()
            )
        ])
    )
    # It's very important to ensure this dataframe has one partition, otherwise
    # the crossJoin below will generate a obscene number of tasks.
    .coalesce(1)
)

users_and_digits = (
    log_data_df
    .groupBy('user_id')
    .agg(F.count('*').alias('count'))
    .filter(F.col('count') > 100 )
    .select('author')
    .repartition('author')
    .crossJoin(digits_df)
)

# Now join the users_and_digits dataframe to digit_share_df in order
# to insert the missing rows.

finalized_digit_share_df = (
  digit_share_df
  .join(
        users_and_digits,
        on=['user_id','first_digit'],
        how='right'
    )
    .na.fill(0)
    .cache()
)
The final step is to compare the first digit share of each user to the ideal share distribution of Benford’s Law, and calculate a \chi ^{2} score for each user.
from math import log10, sqrt

digits = [1, 2, 3, 4, 5, 6, 7, 8, 9]
expected_share_list = [(d, log10(d+1)-log10(d)) for d in digits]

expected_share_df = (
    spark
    .createDataFrame(
        expected_share_list,
        schema=T.StructType([
            T.StructField(
                'first_digit',
                T.IntegerType()
            ),
            T.StructField(
                'expected_share',
                T.DoubleType()
            )
        ])
    )
    .coalesce(1)
)

user_benford_distances = (
    finalized_digit_share_df
    .join(
        F.broadcast(expected_share_df),
        on='first_digit',
        how='inner'
    )
    .withColumn(
        'chi_squared_addends',
        F.pow(
            (F.col('first_digit_share') - F.col('expected_share')),
            F.lit(2)
        ) / F.col('expected_share')
    )
    .groupBy('user_id')
    .agg(
        F.sum('frequency_count').alias('frequency_count'),
        F.sum('chi_squared_addends').alias('chi_squared'),
        F.collect_list(F.col('first_digit_share')).alias('digit_share')
    )
)
At this point you can sort the user_benford_distances data frame by the chi_squared values to identify bots and humans. chi_squared values closer to 0 are more likely to be human, and values furthest from 0 or more likely to be bots.
Finding Bot Commenters on Reddit
Now that we have established a methodology for applying Benford’s Law to user log data in order to identify bot users, let’s apply it to a real word case. A great publicly available data set of user interactions is the Reddit user comments data set that contains all user comments between 2005 and 2017. You can download via a BitTorrent that is listed at the Academic Torrents website. Note that this file is about 305 GB in size. It will take a while to download and likely cause you to bust any data caps that your internet provider has. One way to mitigate these issues is to pace the download, as most BitTorrent clients allow you to set a maximum download rate. However, slowing down the download rate will only make the download take longer. If you are going to work on this in some cloud environment such as AWS, data ingestion is usually free, so you don’t have much to worry about there.
Once the Reddit data set is downloaded, you need to convert the data into a more usable format for Spark, which is parquet. Performing this step significantly improves the performance of any subsequently analysis. My code for converting the raw Reddit data to a parquet file can be found here on Github. You will note that I use the Quantcast File System for my data storage, and thus all file paths in my code are preceded with qfs://. You can easily update this code to refer to the file storage mechanism fo you choice, such as HDFS.
Once the data is in parquet files, then the analysis I described above can be performed on it. My code for doing that can be found here on Github. One thing I did differently than with the code I laid out above is I tried to make the code partially generic, creating a function into which you pass a user event log data frame, the name of the user ID column and the name of the timestamp column, and the function returns a data frame which gives the results of the \chi ^{2} test for each user’s adherence to the Benford’s Law distribution. This would make it easier to apply this code to other user activity logs.
Based on this analysis, I find that the following Reddit users are likely bots based on their commenting behavior:
the_yaya(comments) – You can see that this user’s comments are clearly auto-posted at regular intervals.morganmikolas(comments) – This one is fascinating. It looks like a bot that just hurls random insults in a specific subreddit.nekoatsumepw(comments) – This person looks to be automatically posting a daily password for a game or something.acini(comments) – This user looks to be a human, but several years ago he posted a bunch of “source” comments. My guess is he did this in an automated manner, thus the activity looks bot-like.itsstylerr(comments) – At first glance you might think Benford’s Law got it wrong on this user. But if you look closely at the comments, you will notice that they are repeated after a while. Furthermore, some of the comments simply don’t make sense in context. My guess here is that this user automated random comments in the hopes of building up karma on Reddit.ThatCzar(comments) – Another person who looks to be generating automated comments for karma.
There are more, many with the word “bot” in the name. Clearly having the word “bot” in the user name is another predictor as to whether a user is a bot or not.
Conclusion
When applied right, Benford’s Law can be a useful tool in identifying fraud or non-human activity. The technique for applying Benford’s Law against very large data sets using Apache Spark is straight forward and a great data science project to do on your own.